Connecticut homes took longer to find a buyer in August 2026, but median closed-sale prices increased. That is the central message from CT REALTORS’ August price and inventory report and SmartMLS’s August marketing-time data. Buyers may have more time to compare properties; sellers should not assume that higher prices guarantee an immediate offer.
Published September 21, 2026. Reporting period: August 2026, compared with August 2025. These are August results, not September sales figures. The practical focus is the longer selling window—and why it matters differently depending on location and property type.
1. The statewide numbers: prices rose, but inventory varied
Connecticut’s single-family median closed-sale price reached $520,300 in August, up 6.2% from a year earlier. The condo and townhouse median reached $315,000, up 5.0%. Inventory barely changed for single-family homes but expanded substantially for condos and townhouses, according to the dated CT REALTORS summary.
| August 2026 metric | Single-family homes | Condos and townhouses |
|---|---|---|
| Median closed-sale price | $520,300; up 6.2% | $315,000; up 5.0% |
| Homes for sale | 5,737; down 0.7% | 1,764; up 20.3% |
| Closed sales | 2,625; down 6.2% | 692; down 7.2% |
These figures cover existing-home transactions reported through SmartMLS, using data pulled September 8, 2026. They are not a census of every Connecticut sale. All percentage changes in the table are year over year, not month over month.
The inventory distinction matters. Someone shopping for a detached house did not see a broad statewide increase in supply compared with August 2025. A condo buyer had a larger statewide pool of listings, although that does not establish how many suitable units were available in a particular town, building or budget.
Also, a median is the midpoint of the homes that actually sold. It is not an asking-price measure, and a 6.2% increase does not mean every single-family home gained 6.2% in value.
2. Four or five extra marketing days are useful—not a discount signal
Average days on market increased from 22 to 26 days for single-family homes and from 26 to 31 days for condos and townhouses. SmartMLS measures this interval from listing to offer acceptance, not from listing to closing. These figures come from the August Monthly Indicators detail page, with data current September 8, 2026.
Four or five additional days can matter when arranging a second showing, comparing monthly ownership costs or reviewing documents. But an average is not a waiting period buyers can safely apply to every listing. Some properties will attract an accepted offer sooner; others will remain available much longer.
Nor does longer marketing time establish that sellers are accepting lower prices. The August evidence shows longer marketing times alongside higher closed-sale medians. It does not provide a statewide discount rate or prove that every buyer gained negotiating leverage.
The useful distinction is between more time to evaluate and more power to negotiate. The first may help a buyer make a better-informed decision. The second depends on the individual home’s price, condition, alternatives and seller’s willingness to accept particular terms.
3. Hartford and New Haven counties had different selling windows
The county comparison makes the statewide average more useful. Both counties recorded higher single-family median prices and small inventory increases, but their changes in marketing time were noticeably different.
The figures below come from SmartMLS Local Market Updates for Hartford County and New Haven County, current September 8, 2026. Both original reports are available through third-party-hosted copies.
| Single-family metric, August 2026 | Hartford County | New Haven County |
|---|---|---|
| Median closed-sale price | $464,500; up 9.3% | $475,000; up 8.2% |
| Homes for sale | 1,041; up 1.9% | 1,341; up 1.2% |
| Average days on market | 17, versus 16 a year earlier | 28, versus 21 a year earlier |
| Closed sales | 637; down 4.9% | 537; down 2.5% |
In Hartford County, one additional average marketing day is a modest change. Paired with only a small inventory increase, it is not strong evidence of a major shift in buyer negotiating power.
New Haven County’s increase from 21 to 28 days represents a more noticeable change in the selling window. Even there, the median closed price rose 8.2%. A seller should allow for a potentially longer marketing period without assuming a lower sale price; a buyer should investigate the listing rather than assume an automatic discount.
Neither county average supplies a timeline for a particular home. Narrow the comparison to the town, property type, size, condition and price range before setting expectations.
4. Town checks: West Hartford and Greenwich need their own context
West Hartford: a supplementary check on the county headline
William Pitt Sotheby’s August 2026 West Hartford report lists 62 single-family sales, a $571,000 median closed price and 13 average days on market, compared with 11 a year earlier. Its reported median increased just 0.2%, rather than the 9.3% increase in the broader Hartford County report.
Treat this as supplementary evidence. It is a brokerage-published report without a displayed publication or data-pull date, not an independently verified town-level MLS extract. Still, it provides a useful reason to request town-specific comparable sales rather than apply the county’s price increase to a West Hartford property.
Greenwich: keep the separate MLS sample separate
In Greenwich, in Fairfield County, the separate CT REALTORS Greenwich MLS summary reports an August single-family median closed price of $3.95 million, up 41.0%. There were 37 sales, down from 58 a year earlier, while inventory fell 25.6% to 87 homes. The data were pulled September 9, 2026.
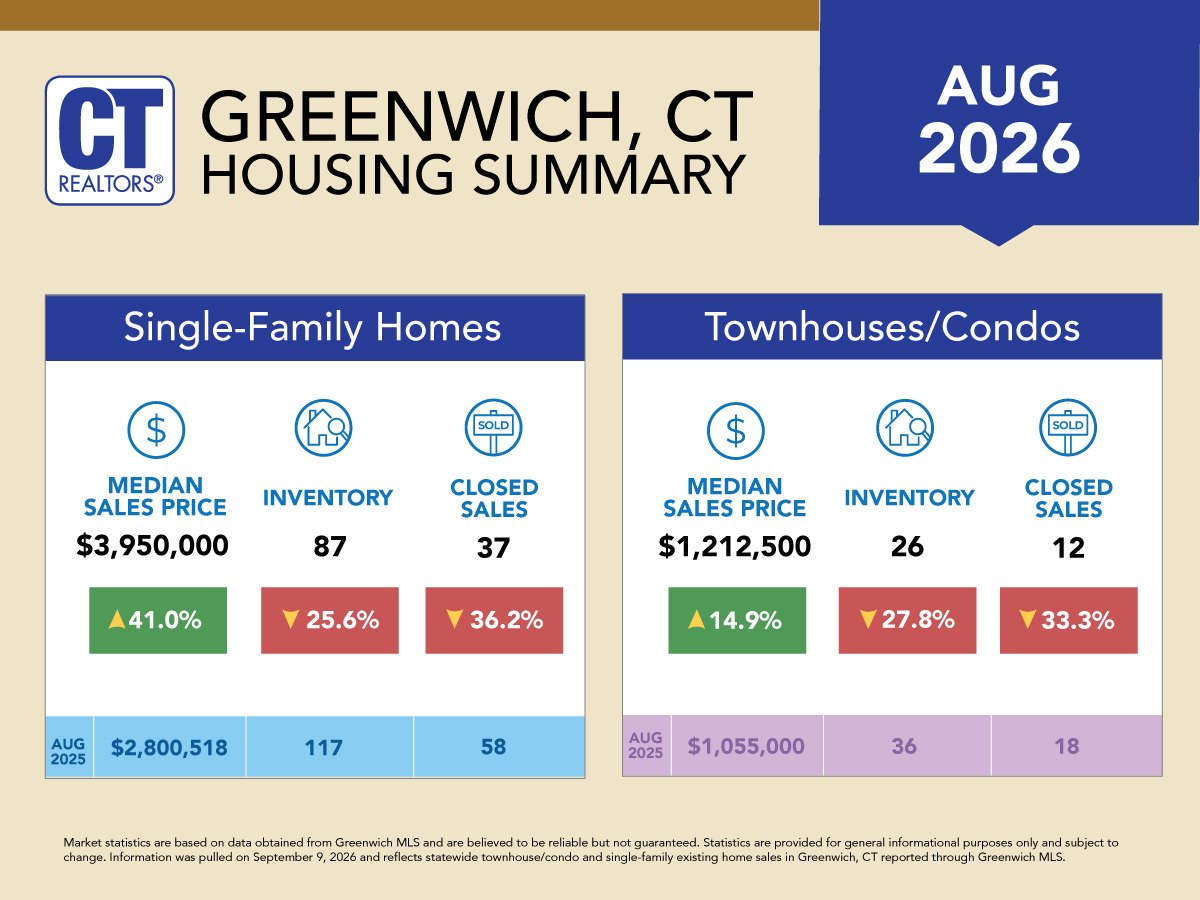
That is a town-level luxury-market result from a separate MLS summary—not a Fairfield County statistic or a number to blend casually into the statewide report. The 41.0% median increase does not establish that individual Greenwich homes appreciated by that amount. The mix of properties closing in a month can move the median, particularly in a smaller sample.
5. For buyers: use the extra time to compare specific alternatives
The August numbers support a more deliberate search, not a blanket strategy of waiting for price cuts. Build your decision around the homes you could actually buy.
- Define a workable comparison group. Ask for current listings, recently accepted offers where information is available, and recent closed sales in your target town and price range. Separate detached homes from condos. Compare living area, layout, lot, parking and documented condition rather than relying only on a headline median.
- Review the listing’s full history. Establish when it entered the market, whether its asking price changed and whether it was previously listed. Ask what the displayed days-on-market figure includes. A longer listing history is a reason to investigate pricing and condition, not proof that something is wrong.
- Turn a longer window into due diligence. If scheduling permits, arrange a second visit and resolve material questions before committing. Confirm property details with municipal records and obtain property-specific cost estimates. Do not interpret a statewide 26-day average as permission to postpone action on a home that fits.
- Evaluate condo selection alongside ownership obligations. More statewide condo inventory can broaden a search, but compare association charges, financial documents, insurance responsibilities and planned work. A lower purchase price alone does not establish a lower total ownership cost.
The tradeoff is straightforward: waiting may bring another suitable listing, but it may also mean losing the one you prefer. Set a price limit and identify the information you need to make an offer, rather than treating the calendar as a prediction tool.
6. For sellers: plan for the marketing period, not just the price
Higher statewide medians are context, not a pricing formula. Your asking price needs support from comparable closings and the alternatives buyers can visit now.
- Build two comparison sets. Recent closed sales show achieved prices. Current competing listings show the choices buyers face, but their asking prices are not evidence of what those homes will ultimately sell for. Explain meaningful differences in size, condition, features and location.
- Set a review date before listing. Agree with your agent on when to assess showing activity, buyer feedback, new competing listings and offers. Use comparable local marketing times to inform that review rather than assuming last year’s selling speed still applies.
- Identify what would justify a change. Limited activity may call for reviewing the price, presentation or showing access. Repeated concerns about a documented property condition may require a different response. Decide based on the evidence, not one isolated comment.
- Separate marketing time from closing time. An accepted offer is not the closing. When coordinating a move or another purchase, build the schedule around the proposed contract terms and confirm timing with the professionals handling the transaction.
An ambitious asking price can be tested, but additional market time brings carrying costs and uncertainty without guaranteeing a higher result. Conversely, a statewide slowdown is not by itself a reason to cut the price of a well-supported listing. The Hartford–New Haven comparison reinforces the need for local expectations.
7. Quick FAQ
Longer selling times versus falling prices
August’s statewide data do not show falling median closed-sale prices for either property category. Longer marketing times and higher medians occurred together. Individual price reductions or negotiated discounts require listing-level evidence; neither can be inferred from the statewide average alone.
Fewer closings versus more available homes
Closed sales count completed transactions during the reporting period. Inventory measures homes available for sale. They describe different parts of the market, so fewer closings do not automatically mean inventory increased. August’s single-family figures illustrate that distinction.
How current these figures are
The principal snapshots were pulled September 8–9 and remain subject to revision. SmartMLS notes that closed transactions can take one or two weeks to be fully reported in its methodology FAQ, updated July 10, 2026. For a decision today, request a fresh town-level report with its reporting period and data-pull date clearly identified.
Sources
- CT REALTORS: August 2026 statewide summary.
- SmartMLS Monthly Indicators: August 2026 marketing-time detail; link updates over time.
- SmartMLS August county reports: Hartford and New Haven.
- CT REALTORS: August 2026 Greenwich summary.
- William Pitt Sotheby’s: West Hartford report, supplementary town evidence.
- SmartMLS Stats methodology FAQ.
Contact Nomade for a comparison of recent sales, competing listings and marketing times in your Connecticut town and price range.